CARDIAC › rust-cardiac › Using rust-cardiac with vscode
Using rust-cardiac with vscode
vscode already knows Rust. Add two extensions and two small config files and you can write, run and
debug a CARDIAC program without leaving the editor. It works because every rust-cardiac program is also an
ordinary Rust program. You do most of your work natively, the way you always do, and CARDIAC is one task away.
What you need
rust-cardiac installed (the Quick start takes a minute), vscode, and two extensions:
rust-analyzer, and
CodeLLDB for debugging.
Start a program
cargo cardiac new countdown
code countdown
Open src/main.rs. rust-analyzer puts Run and Debug above main.
Run it natively
Click Run. The program waits for a card, so type 5 in the terminal and press Enter. It counts down to 0.
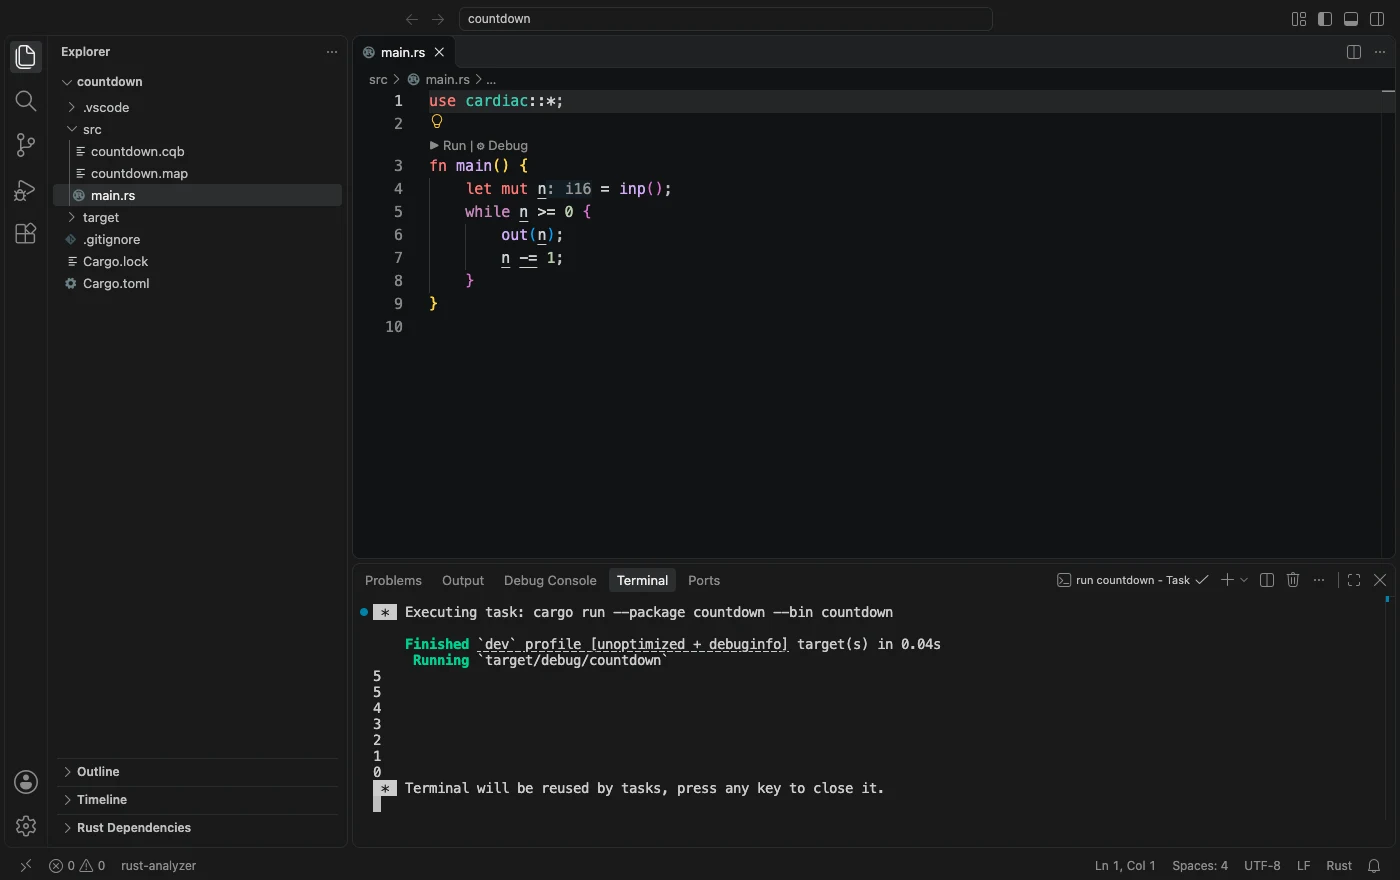
cargo run, from rust-analyzer's Run above main.
Now run it on CARDIAC
Add a task, in .vscode/tasks.json:
{
    "version": "2.0.0",
    "tasks": [
        {
            "label": "Run on CARDIAC",
            "type": "shell",
            "command": "cargo cardiac run",
            "problemMatcher": ["$rustc"]
        },
        {
            "label": "Open in Cardigan",
            "type": "shell",
            "command": "cargo cardiac view",
            "problemMatcher": ["$rustc"]
        }
    ]
}
Choose Terminal ▸ Run Task ▸ Run on CARDIAC and type 5 again. Same program, same answers, except this
time they came from a nine-cell CARDIAC program that ran 70 instructions.
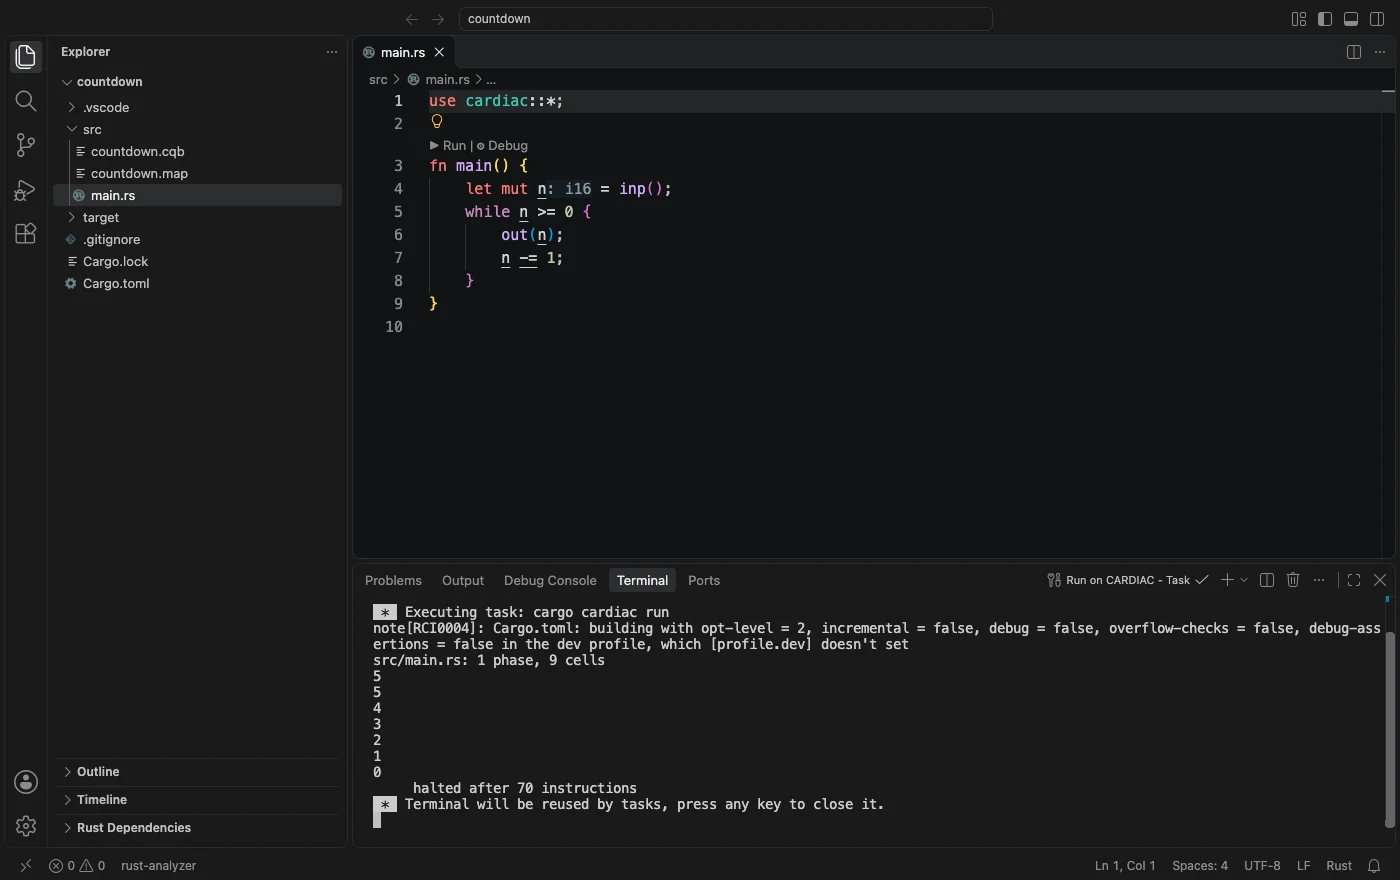 The Run on CARDIAC task: the same numbers, from the deck.
Debug it natively
Breakpoints, stepping and variables all work the way they do for any Rust program, because CodeLLDB is debugging
the native build. Add a launch configuration, in .vscode/launch.json:
{
    "version": "0.2.0",
    "configurations": [
        {
            "name": "Debug natively",
            "type": "lldb",
            "request": "launch",
            "cargo": { "args": ["build", "--bin=countdown"] },
            "terminal": "integrated"
        }
    ]
}
Set a breakpoint on out(n), press F5 and type 5 in the terminal. It stops on the breakpoint with
n in Variables, the call stack below it, and the usual step buttons at the top. On a Mac the debugger
needs Developer Tools access: allow it if macOS asks, or turn it on once with
sudo DevToolsSecurity -enable.
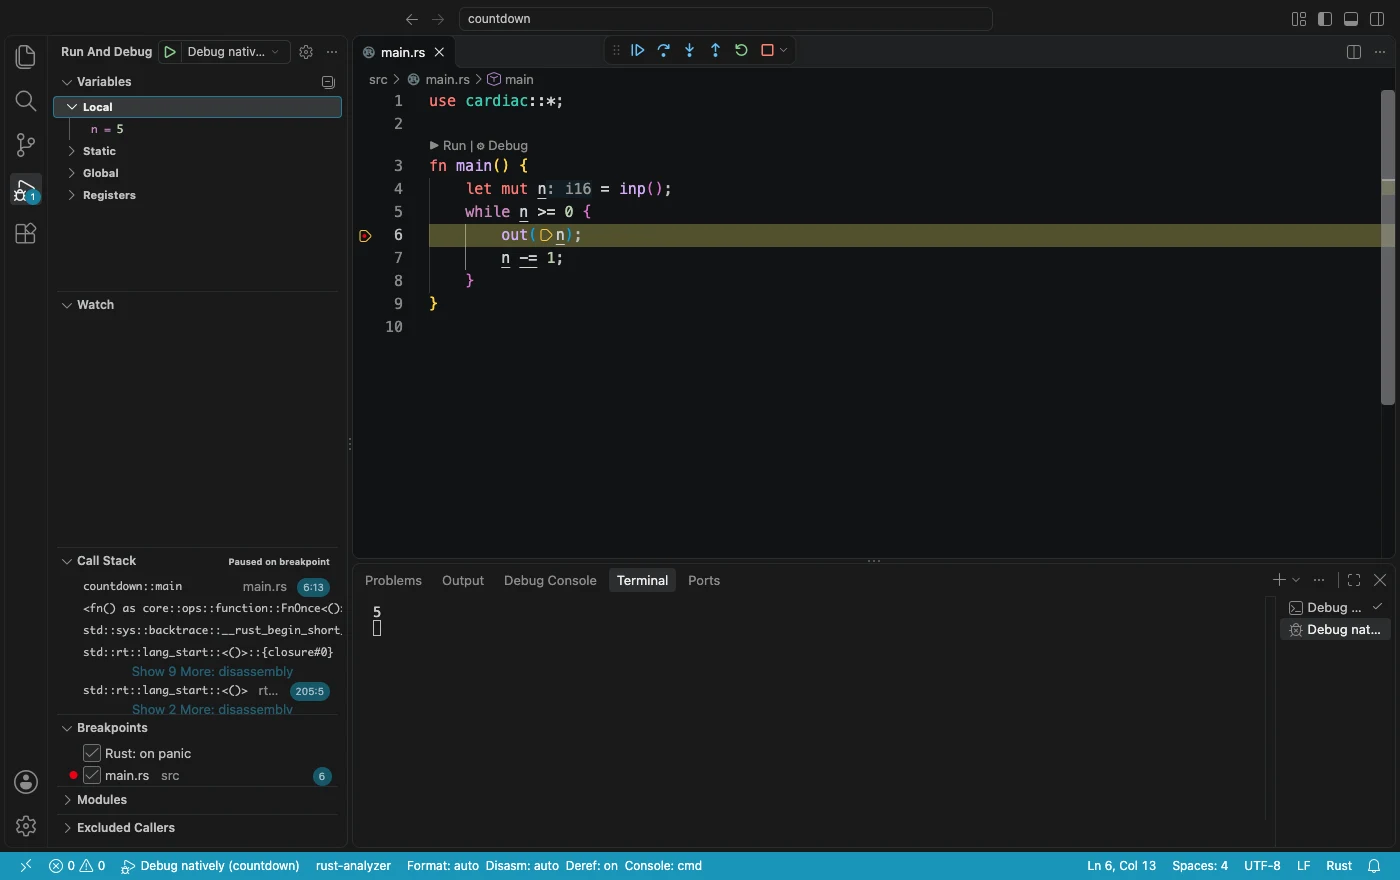 CodeLLDB on the native build, stopped at
out(n) with n = 5.
Debug the CARDIAC code in Cardigan
When you want to see what your Rust actually became, the second task runs cargo cardiac view. Choose
Terminal ▸ Run Task ▸ Open in Cardigan and your browser opens Cardigan with the
program loaded and stopped at its first instruction, with the 5 already in its reader.
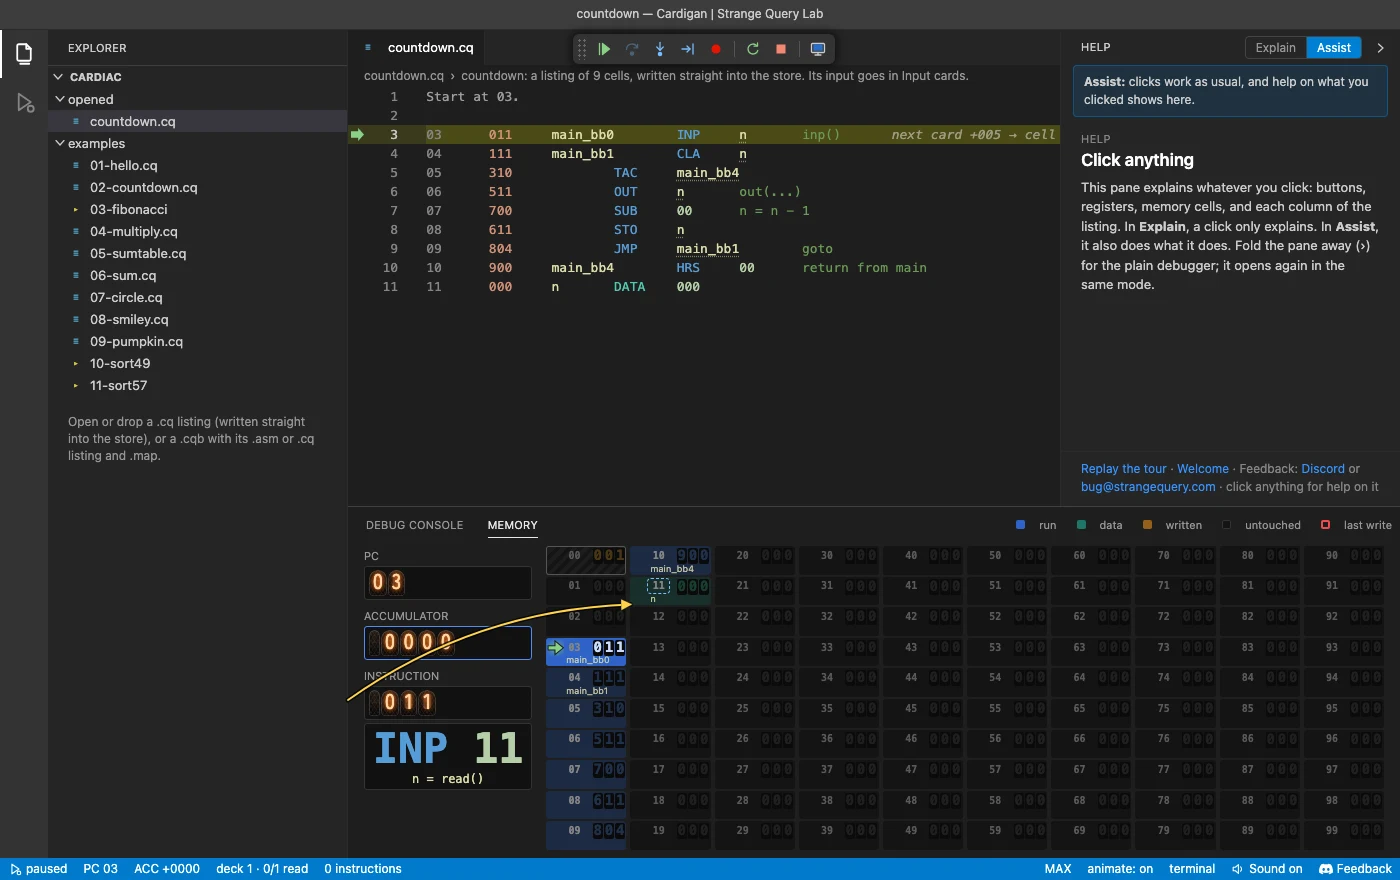
cargo cardiac view: the CARDIAC code, ready to step through.
The build writes countdown.cqb and countdown.map next to main.rs. They're
build output, so you'll probably want them in .gitignore.